那須町大字高久乙 800-74 ハザード地図
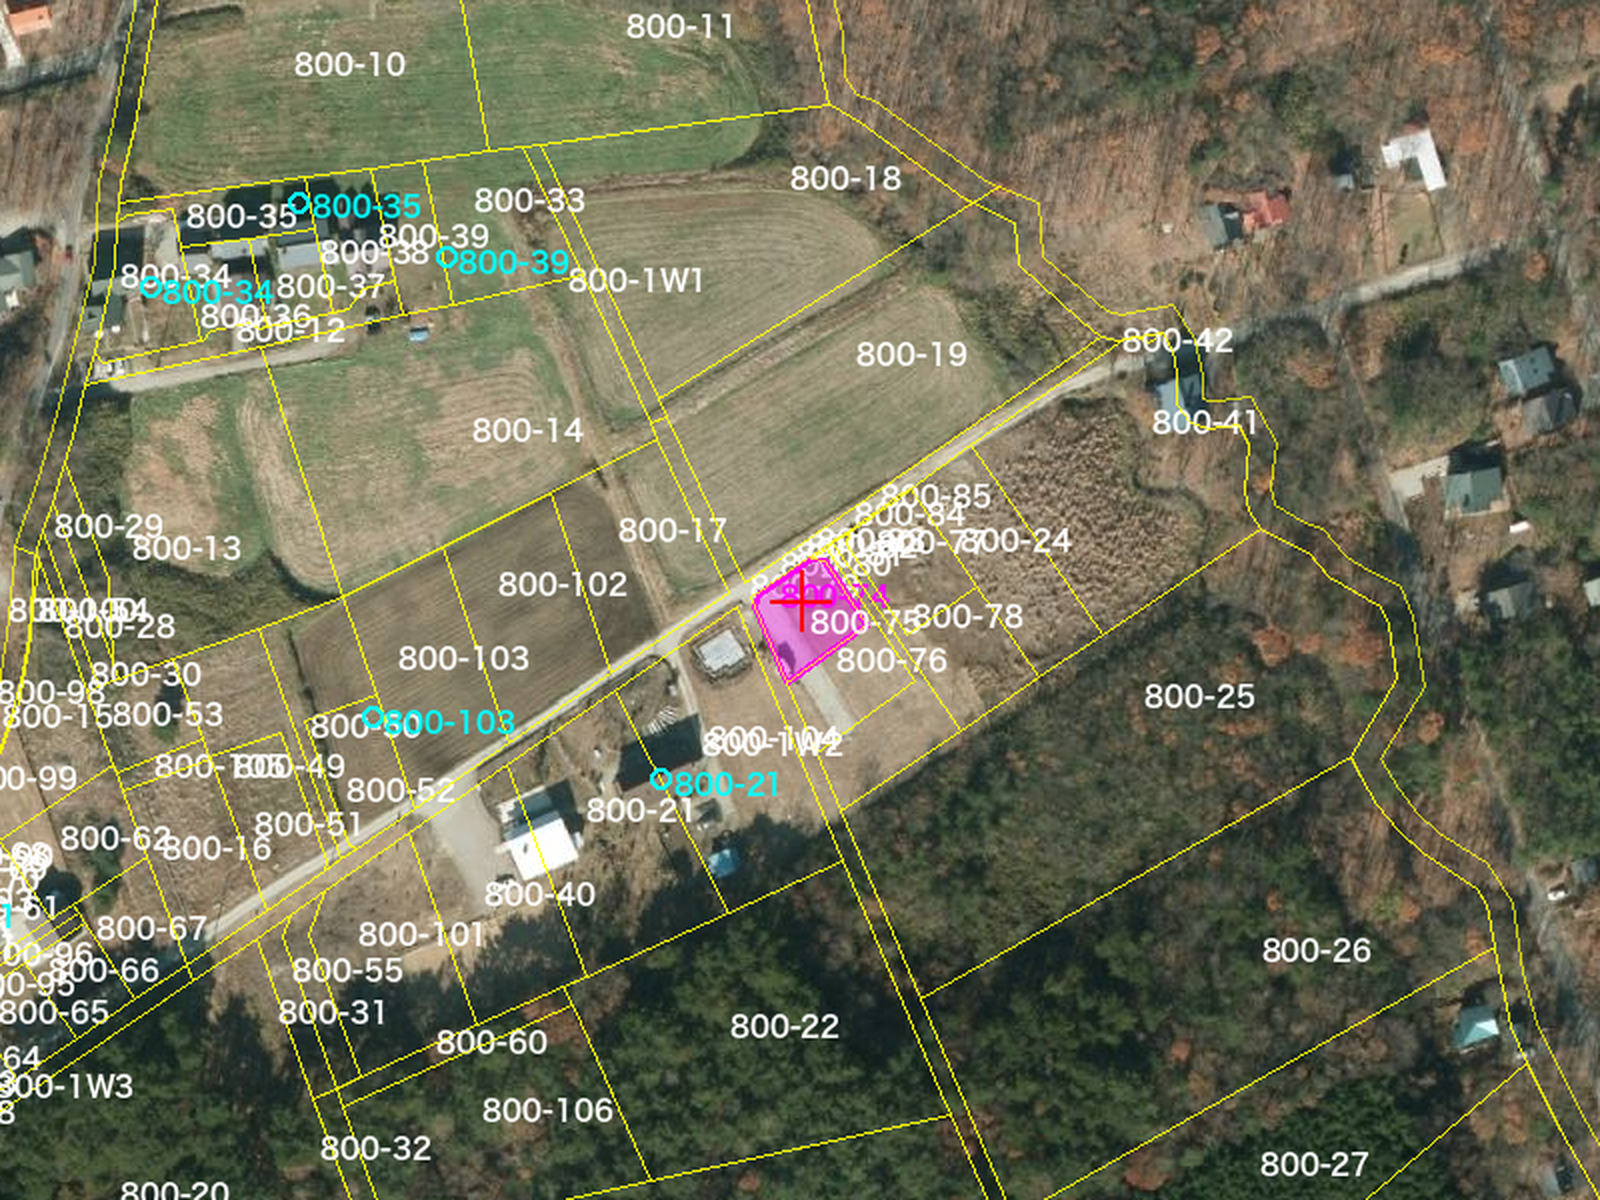
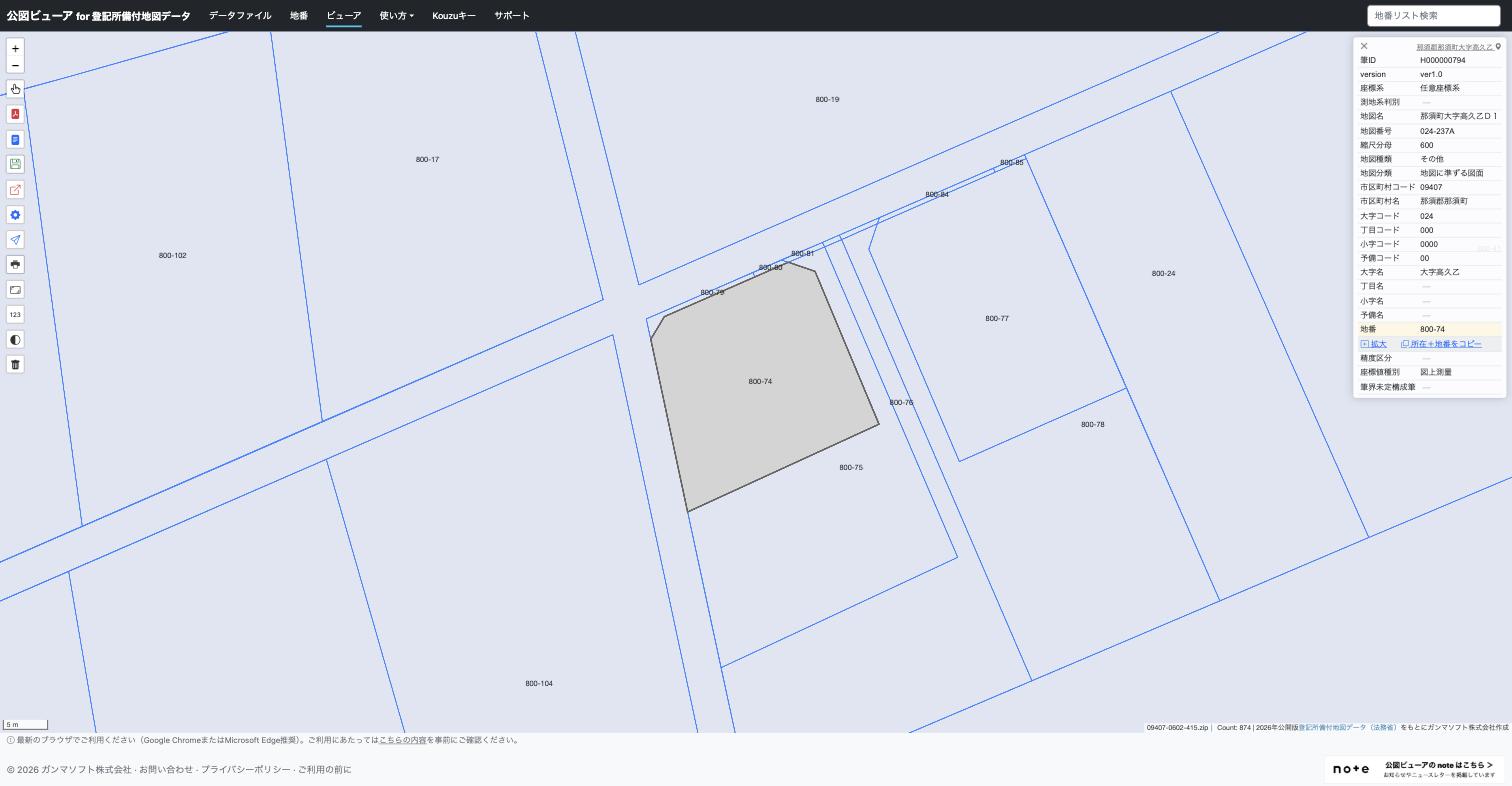
Lot and parcel map
Base map (国土地理院)
洪水 Flood (GSI 重ねるハザードマップ)
土砂災害 Landslide
地形 Landform
火山 Volcano (那須町 火山防災マップ 令和5年1月改訂)
那須町 2026 ハザードマップ (scan)
Opacity
Hazard profile: 栃木県那須郡那須町大字高久乙 800-74
Prepared 2026-09-20. Lot centroid 37.048993 N, 140.008334 E (confirmed by the owner-side reader on 2026-09-20). Elevation 487.5 m (GSI 1 m LiDAR DEM). Interactive map with every layer toggleable: https://nasu-pink-castle-hazard-map.pages.dev
Verdict
On every official map that exists for this spot, the lot is drawn as white: no flood inundation zone, no landslide warning zone, no reservoir failure zone, no volcanic projectile, pyroclastic flow or lahar zone, and no 1998 flood outline reaches it. The nearest mapped hazard is the 湯川 flood band about 300 m to the east, and the nearest landslide zones are 1.3 km to the south-west along the 高雄股川 and 清水川 gorges. The lot sits mid-slope on a gentle south-east facing rise, not in a hollow. What the maps do not cover matters more here than what they show: the national landform classification is simply not published for this area, the prefecture says its landslide survey is unfinished, an unmodelled creek runs about 100 m east of the lot 4 m below it, the town's volcanic mudflow map puts the lot in a gap between two lahar lobes with a positional error large enough that the eastern lobe could touch it, and the expected earthquake shaking for the local M6.9 scenario is 震度6弱. Ash of 20 cm or more is the town's own figure for a magmatic eruption if the wind blows this way. Treat this as a low-risk lot for flood and landslide, an ordinary risk for shaking, and an unresolved but probably-outside position for volcanic lahar that is worth one phone call to the town.
Summary table
| Hazard | Status at the lot | Nearest zone (distance, direction) | Source and date | Confidence |
|---|---|---|---|---|
| 洪水 flood (想定最大規模) | Mapped as no risk (blank) | 湯川 band 0 to 3 m, about 300 m E (town sheet) / 277 m E (GSI raster) | 那須町防災マップ 2026年版 6図・7図 (更新 2026-04-16); GSI 重ねるハザードマップ raster 01_flood_l2_shinsuishin (accessed 2026-09-20); 栃木県 とちまるマップ serves the same 国土数値情報 A31b-2023 dataset (2024-06) | High that the lot is outside the modelled zone; the model covers listed rivers only |
| 洪水 flood (計画規模, 浸水継続時間, 家屋倒壊等氾濫) | Mapped as no risk (blank) | 浸水継続時間 band 303 m E; 家屋倒壊等 none within 730 m; 計画規模 tiles absent within 730 m | GSI rasters, accessed 2026-09-20 | High |
| 内水 pluvial | No data: no 内水浸水想定区域 tiles exist within 2.9 km | none | GSI raster 02_naisui_data, accessed 2026-09-20 | Not assessed by any authority |
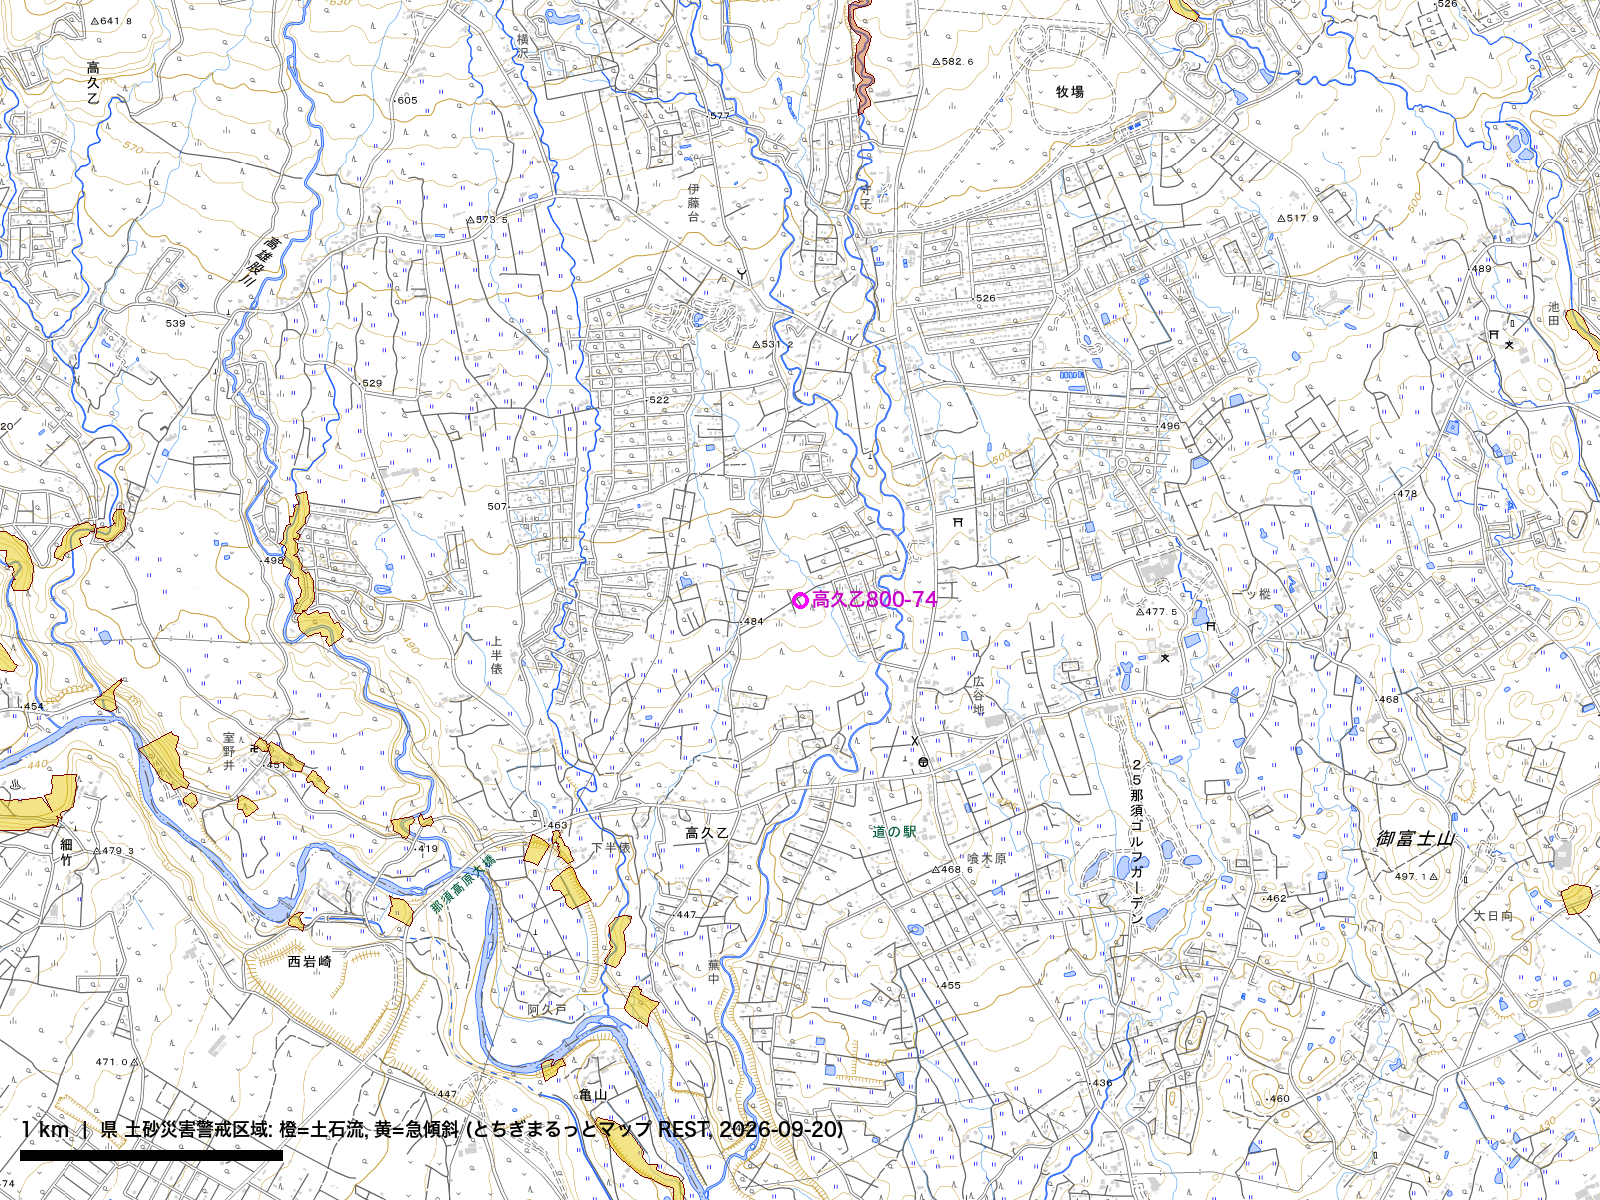
| 土砂災害 landslide (土石流) | Mapped as no risk | 1.85 km N (prefecture polygon 公示図書 7502, updated 2025-11-21); GSI raster agrees at 1.88 km N | 栃木県 とちぎまるっとマップ feature service (service edited 2026-07-31); GSI raster 05_dosekiryukeikaikuiki | High for designated zones; the prefecture states its survey is still in progress |
| 土砂災害 landslide (急傾斜地) | Mapped as no risk | 1.27 km SW (公示図書 407-3-1610, 高雄股川 near 那須高原大橋); town sheet 1.26 km SW, red 特別警戒 cores 1.28 km SW | prefecture feature service 2025-11-21 data; GSI raster; town sheet 2026 | High |
| 土砂災害 landslide (地すべり) | Mapped as no risk | none within 3 km | prefecture feature service; GSI raster | High |
| 土石流危険渓流 (older survey of debris-flow-prone streams) | Not on the lot | stream 290 m E is designated | GSI raster 05_dosekiryukikenkeiryu, accessed 2026-09-20 | Medium; this is a survey list, not a designation |
| ため池 reservoir | Mapped as not affected | nearest panel 千振ダム about 5 km E; prefecture layer has no feature within 3 km and its terms state 那須町 ため池 maps are not carried | 那須町防災マップ 2026 P57-P58; 栃木県 ため池ハザードマップ layer (edited 2026-06-03) | High for the four mapped reservoirs; smaller farm ponds are not mapped |
| 火山 噴石 (ballistics) | Outside | blue circle ends about 5 km from the vent; lot is 9.3 km SE | 那須岳火山防災マップ 一般用 令和5年1月改訂版 (page dated 2023-03-16) | High |
| 火山 火砕流・熱風 | Outside | about 1.0 km N to NW (town sheet reading 1.4 km S of the edge) | same, plus 那須町防災マップ 2026 P13-P14 | Medium (georeference error up to 0.4 km) |
| 火山 融雪型火山泥流 (lahar) | Outside, in a gap between two lobes | east lobe edge about 0.4 km E (0 to 0.8 km with error); west tongue about 0.75 km W | same | Low to medium: the east edge cannot be resolved better than the lot itself |
| 火山 降灰 ashfall | Inside the 20 cm line for a magmatic eruption when wind carries ash this way | n/a | same | Medium |
| 火山 降灰後の土石流 | Outside, at the edge | blue ribbon 200 to 500 m E along the stream past 道の駅 | 那須岳火山防災ハンドブック 令和5年1月改訂版 p9 | Low to medium (error about 0.3 km) |
| 火山 current activity | 噴火警戒レベル1 (活火山であることに留意) | n/a | 気象庁 那須岳 活動状況, accessed 2026-09-20 | High |
| 地震 shaking (揺れやすさ) | 震度6弱 cell for the 那須町直下 M6.9 scenario; 液状化 "対象外" (white) | 震度6強 cells about 1 km E and 2 km S | 那須町防災マップ 2026 P11-P12 (栃木県地震被害想定調査 2014, 250 m mesh, 1:200,000) | Medium; a 6強 cell within a few hundred metres cannot be excluded at that scale |
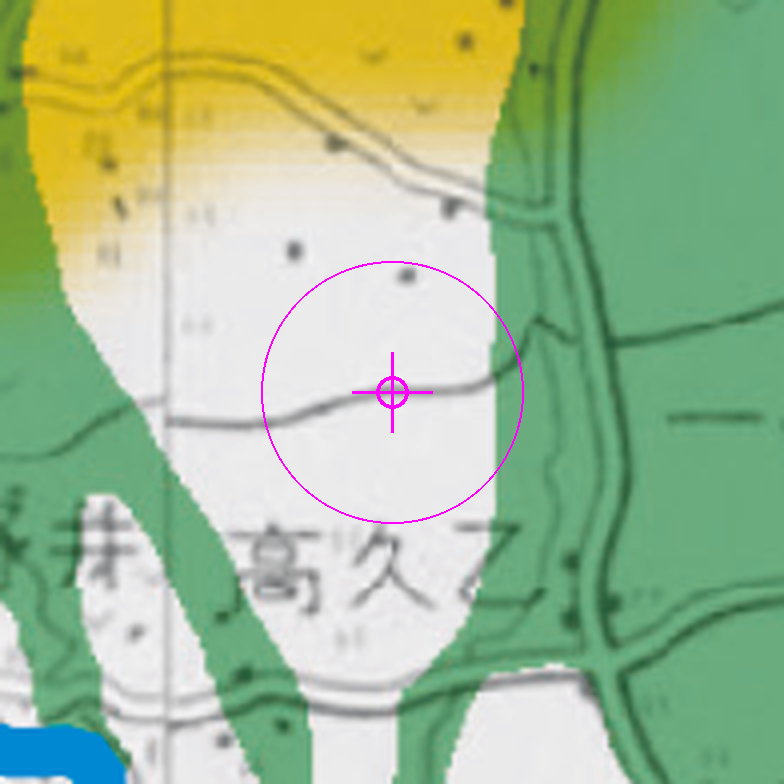
| 地形分類 landform class | No data: GSI has not published landform classification here ("範囲外又は未整備") | n/a | GSI 重ねるハザードマップ 地形分類 layers, accessed 2026-09-20 | n/a |
| 過去の災害 1998 那須水害 | No mapped inundation outline near the lot | outlines are on the eastern sheets along 余笹川 and 黒川 | 那須町防災マップ 2026 P15-P16 and sheets | Medium; the town's page gives rainfall figures, not locations |
The location and how it was fixed
Google Maps, the GSI address API and Yahoo Map resolve this address only to the 大字 or to the "800" block. The Digital Agency address registry lists 地番 800-74 but carries no coordinate for any lot in 高久乙. The lot was therefore located from the 法務省 登記所備付地図 (2026年公開版), sheet 09407-0602-415 (那須町大字高久乙 D1, 地図番号 024-237A), obtained through the free 公図ビューア. That sheet is in an arbitrary local coordinate system, so it was georeferenced by a similarity fit of eight sibling parcels in the 800 block to NAVITIME's building coordinates for those lots (RMS residual 15.7 m), then checked visually against the GSI aerial photo where the block boundary, lane and field parcels line up. The 地番 80-74 does not exist in this 大字, so 800-74 is the correct address. Placement accuracy is about 10 to 20 m; the parcel shape is exact. Files: location.json, sources/09407-0602-415.geojson, sources/helmert_v1.json.
Evidence by source
那須町防災マップ 2026年版 (town map, primary local source)
Index page https://www.town.nasu.lg.jp/0030/info-0000004386-2.html, 更新日 令和8年4月16日, base map © 2026 ZENRIN. The lot is on 6図 (P31-P32) near its eastern edge; 7図 (P33-P34) covers the ground immediately east. Both were rendered at 300 dpi (1.27 m per pixel at the printed 1:15,000), mosaicked, and the lot placed by a road junction visible on both the sheet and the GSI map, with a cross-check on 那須中学校 and the 広谷地 junction (placement about 30 m).
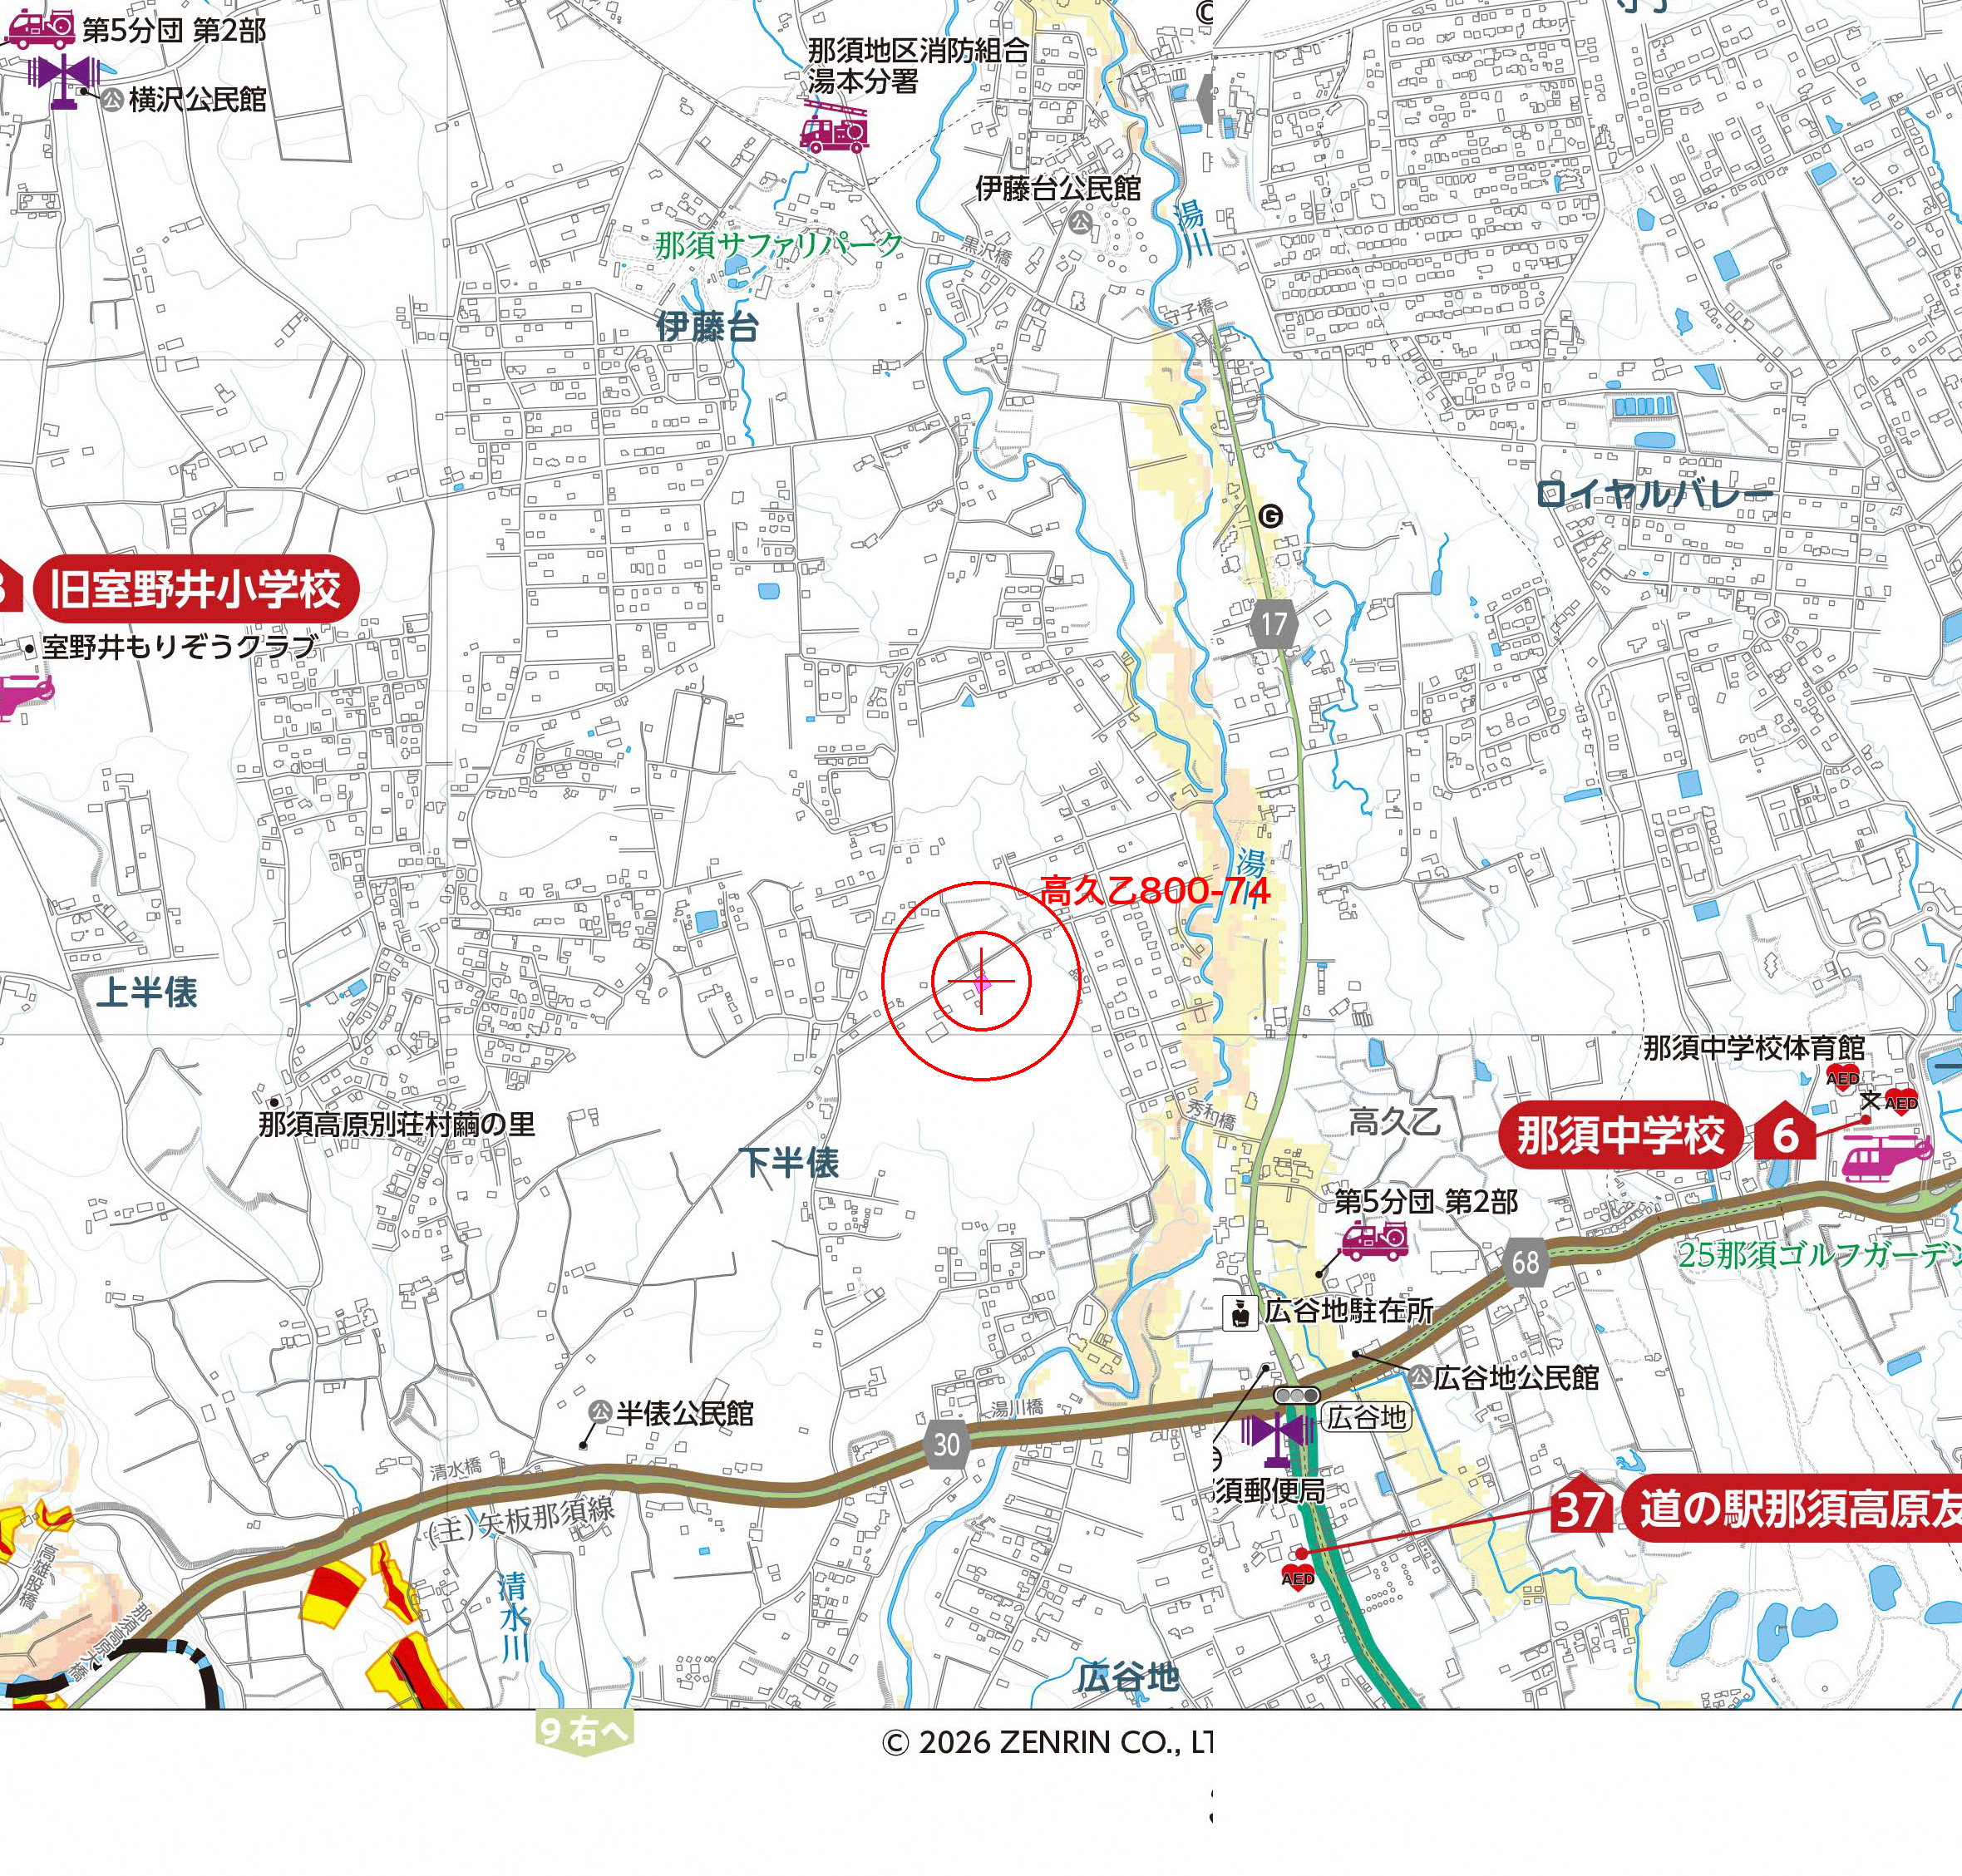
Within 300 m of the lot there is no pixel of any hazard class. Nearest zones on the sheet:
| Zone | Distance | Direction |
|---|---|---|
| 洪水浸水想定区域 0 to 0.5 m and 0.5 to 3 m (湯川) | about 300 m | E |
| 洪水浸水想定区域 3 to 5 m (a few cells in the same band, possibly anti-aliasing) | about 315 m | E |
| 洪水浸水想定区域 5 m and deeper | more than 1.3 km | SW (那珂川 and 高雄股川 near 那須高原大橋) |
| 土砂災害警戒区域 (yellow) | about 1.26 km | SW (清水川 south of 県道30号 near 清水橋; 高雄股川 near 那須高原大橋) |
| 土砂災害特別警戒区域 (red) | about 1.28 km | SW |
| 家屋倒壊等氾濫想定区域, 平成10年那須水害浸水区域, 雪崩, 冠水 | none within the 1.5 km crop |
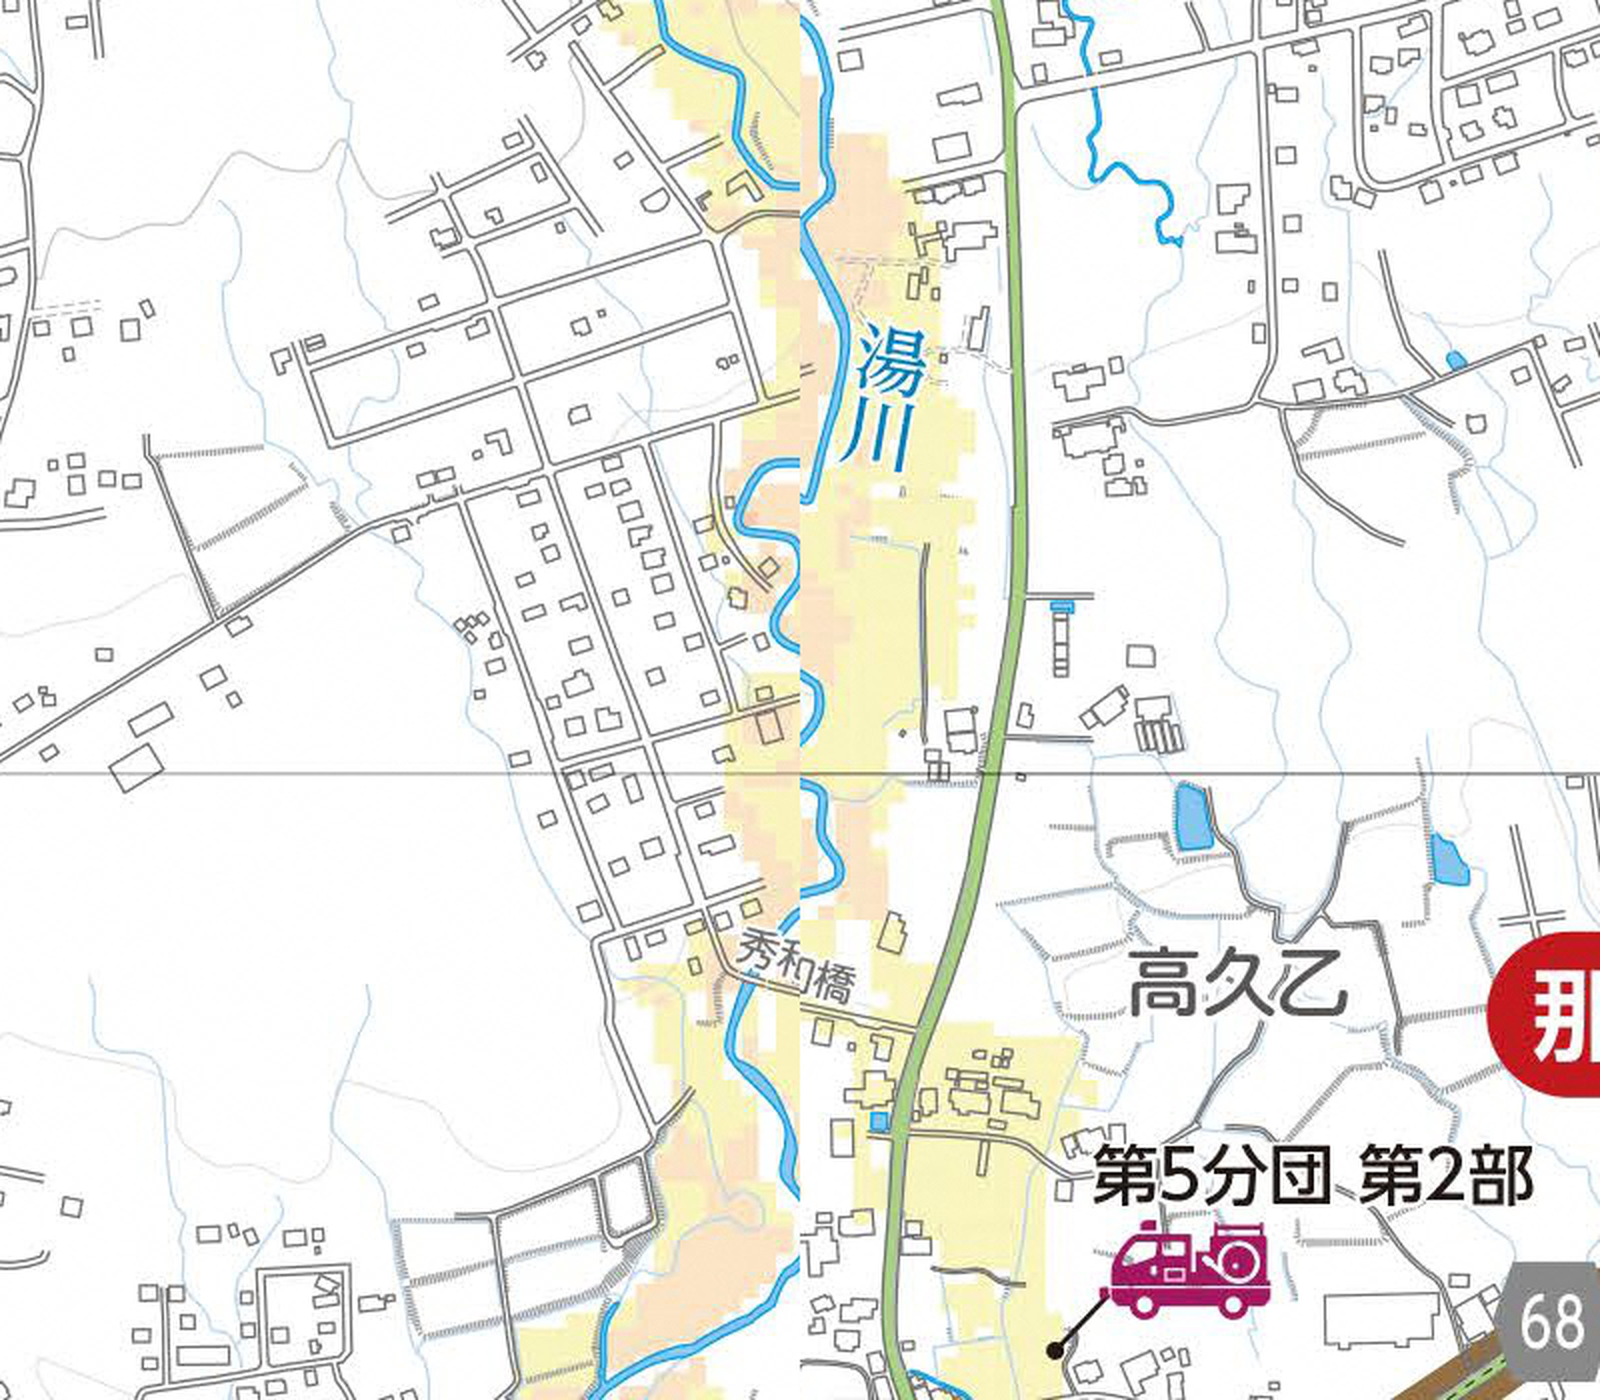
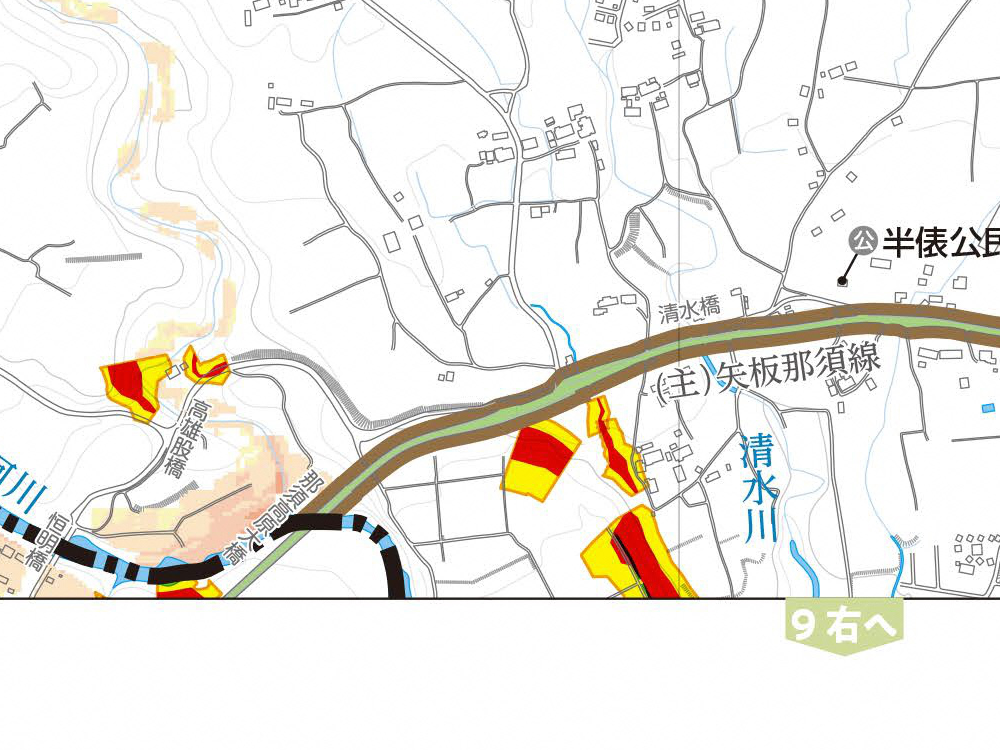
Legend caveats (P17-P18): the flood model covers only the listed rivers (湯川 at a 24-hour rainfall of 690 mm) and ignores tributary bank failure, rainfall beyond the model and pluvial flooding. The landslide zones are described as 栃木県で整備途中段階の資料, so not every zone is on the map, and landslides can occur outside drawn zones. Several thin blue creeks are drawn around the 800 block with no colour.
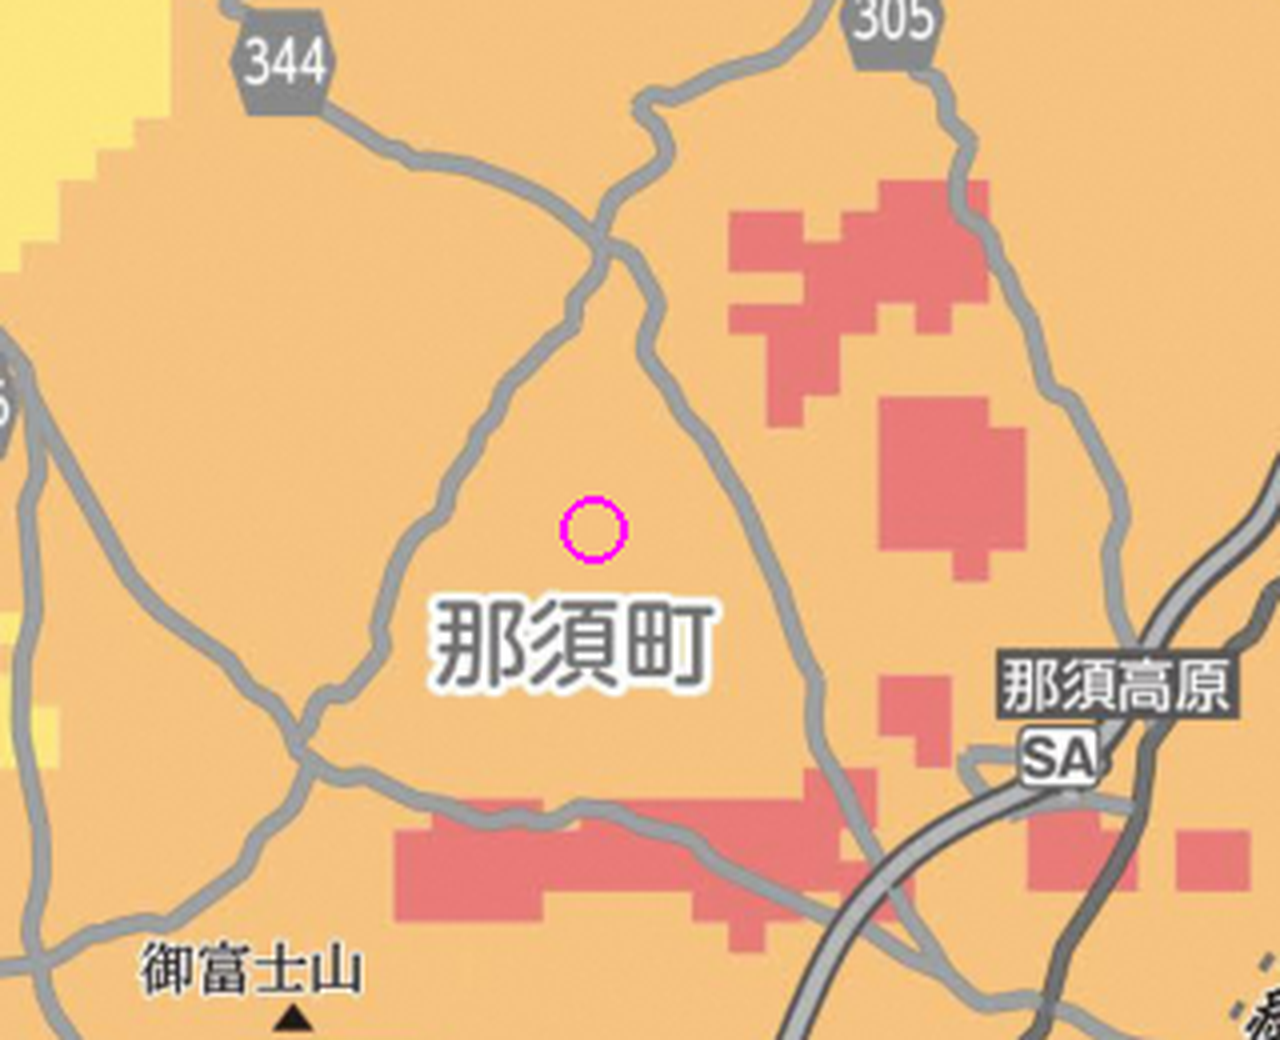
Other pages. P11-P12 揺れやすさマップ: the 250 m cell containing the lot is 震度6弱 for the 那須町直下 M6.9 scenario; 6強 cells begin about 1 km east and 2 km south; liquefaction white. P13-P14 火山対策: the phreatic map does not reach the lot; the magmatic map puts the lot inside the 20 cm ash circle, outside the ballistic circle, about 1.4 km from the pyroclastic edge, and in a gap between two lahar ribbons, about 0.6 km west of the eastern one (placement ±0.5 km at that scale). P57-P58 ため池: four panels (千振ダム, 矢の目ダム, 左内溜池, 江戸川温水); the lot is outside all of them, nearest 千振ダム about 5 km east. P15-P16 過去の災害: the 1998 那須水害 brought 1,254 mm in six days, 607 mm on 27 August with 90 mm per hour, causing floods and landslides across the town; 2011 brought 震度6強. The page names no locations; 余笹川 and 黒川 are not mentioned there, and the 1998 inundation outlines drawn on the sheets lie along those rivers on the eastern sheets, none near this lot. Details: step2_town_map.md.
GSI 重ねるハザードマップ (national)
Opened at the confirmed point at z16. Flood layers on: the lot is blank, the 想定最大規模 band lies along the stream east of the lot. Landslide layers on: yellow and red zones appear only in the west and south-west valleys. Clicking the exact point produced no popup, which is what the site does when no layer has data there. The 地形分類 layer shows nothing and the site's footer reads 「この地形の自然災害リスク: 範囲外又は未整備」, meaning no landform classification is published here.
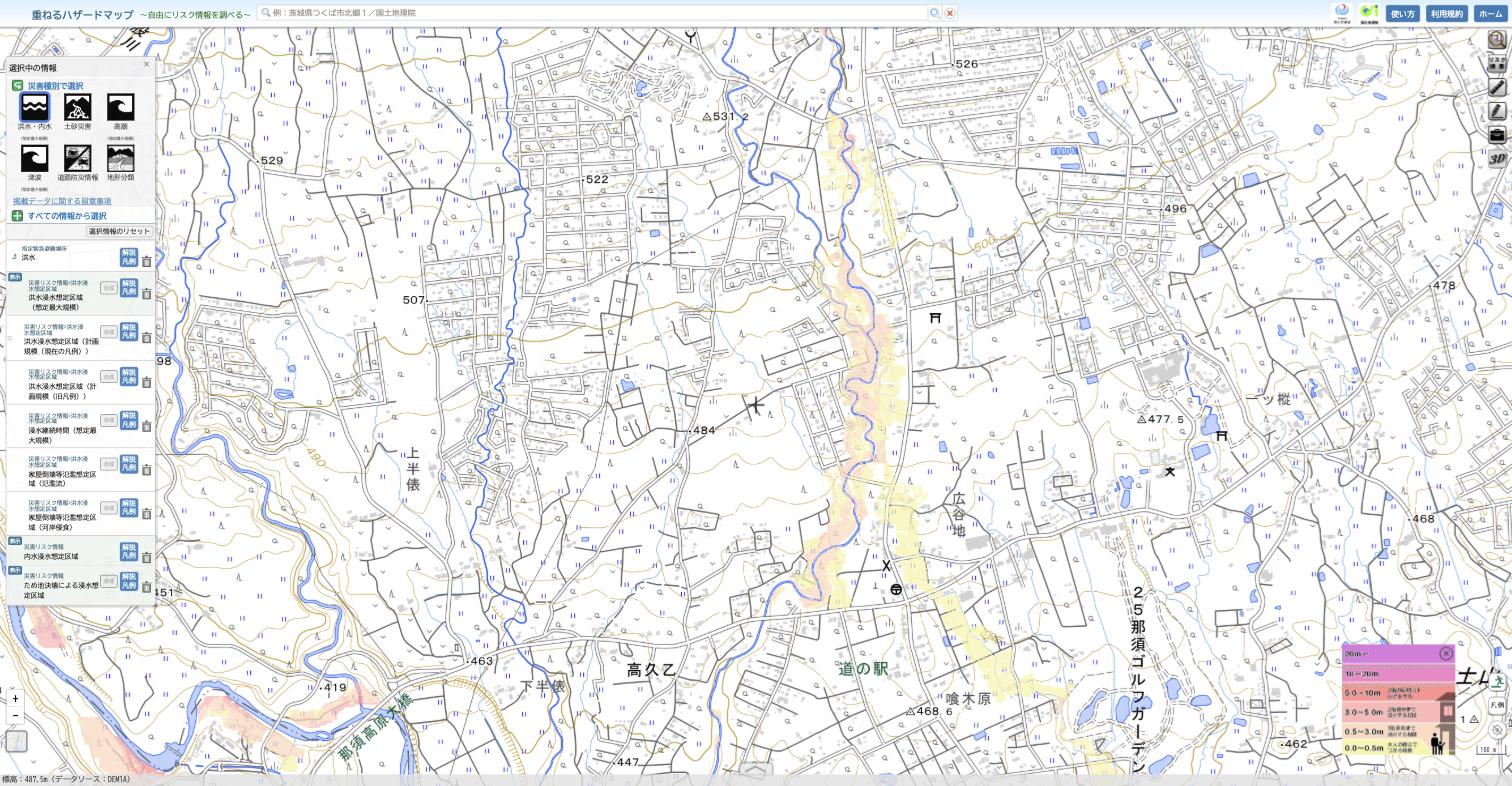
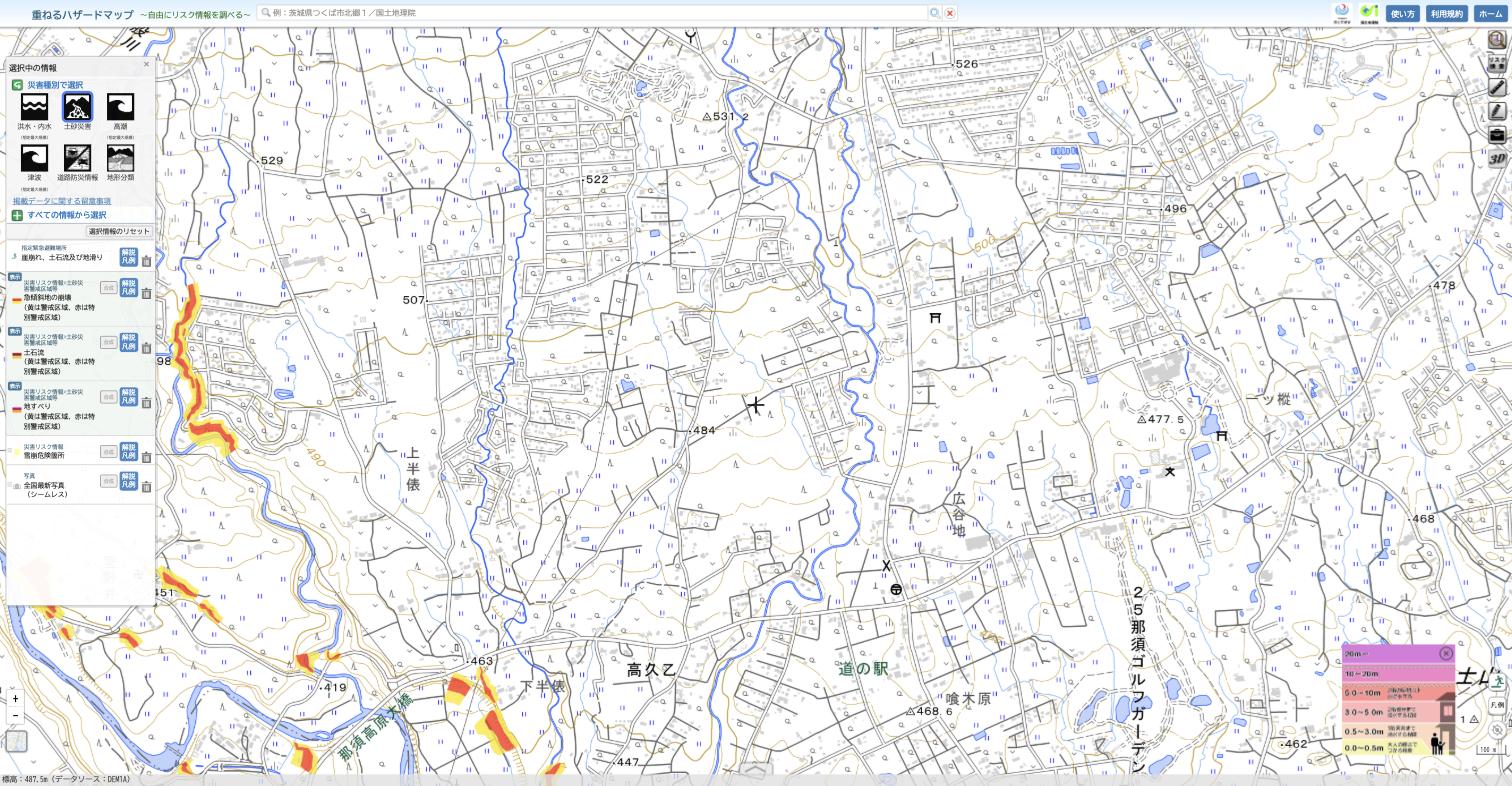
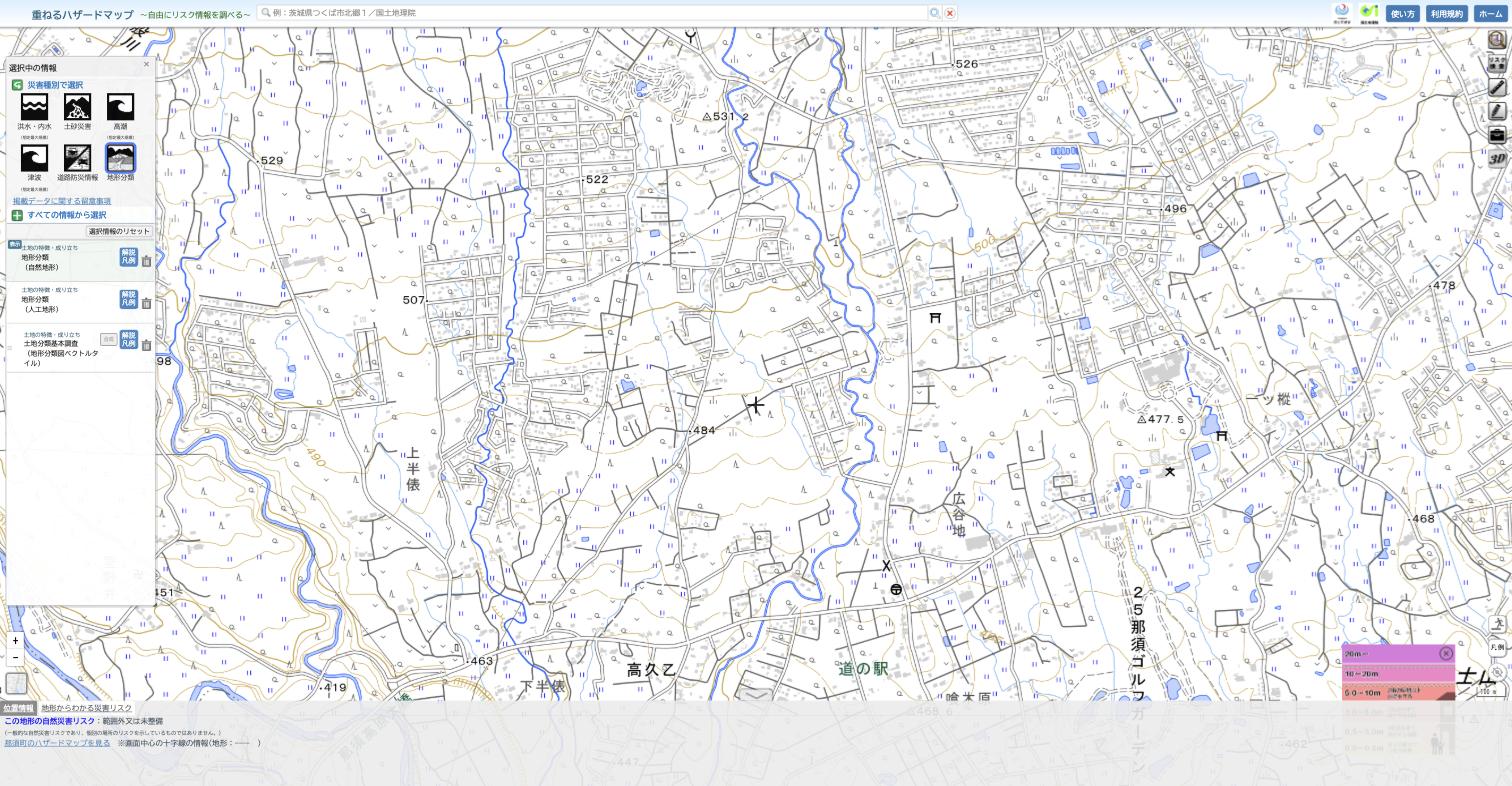
Raster tiles sampled directly (sources/gsi_raster_samples.json, sources/gsi_raster_samples_z14.json): pixel at the lot transparent in every layer; nearest coloured pixel 273 to 277 m E for 想定最大規模, 303 m E for 浸水継続時間, 290 m E for 土石流危険渓流, 1.88 km N for 土石流警戒区域, 1.27 km SW for 急傾斜警戒区域, none within 2.9 km for 地すべり and 内水.
栃木県 (prefecture)
The old とちぎ地図情報公開システム (sonicweb) ended service on 2026-03-31. Its replacement, とちぎまるっとマップ (https://tochimarumap-pref-tochigi.hub.arcgis.com), was queried through its public ArcGIS feature services at the point and within 3 km (sources/pref_layer_query.json). No feature of 土砂災害警戒区域 (土石流, 急傾斜, 地すべり), 急傾斜地崩壊危険区域, 地すべり防止区域, 砂防指定地, 雪崩危険箇所 or ため池ハザードマップ contains the lot. Nearest 土石流 zone 1.85 km N, nearest 急傾斜 zone 1.27 km SW, both with data stamped 2025-11-21. The prefecture's flood layer is ESRI Japan's rendering of the national 国土数値情報 A31b-2023 dataset (retrieved 2024-06), so it adds no prefecture-only rivers; identify at the point returned nothing. The prefecture's browser app shows a terms-of-use dialog that was not accepted on your behalf, so no screenshot of it is included; the same dialog states that 那須町's ため池 hazard map is not available in the prefecture system. No discrepancy between the prefecture and the national map was found at this lot.
那須岳 volcano
Sources: 那須岳火山防災マップ 一般用 and 那須岳火山防災ハンドブック, both 令和5年1月改訂版, from https://www.town.nasu.lg.jp/0030/info-0000000859-2.html (page dated 2023-03-16). The magmatic-eruption map was georeferenced on six landmarks (residuals up to 460 m); the handbook's debris-flow map is north-up and was scaled from the summit and its scale bar (about 300 m error). The lot is 9.3 km south-east of the 茶臼岳 vent.
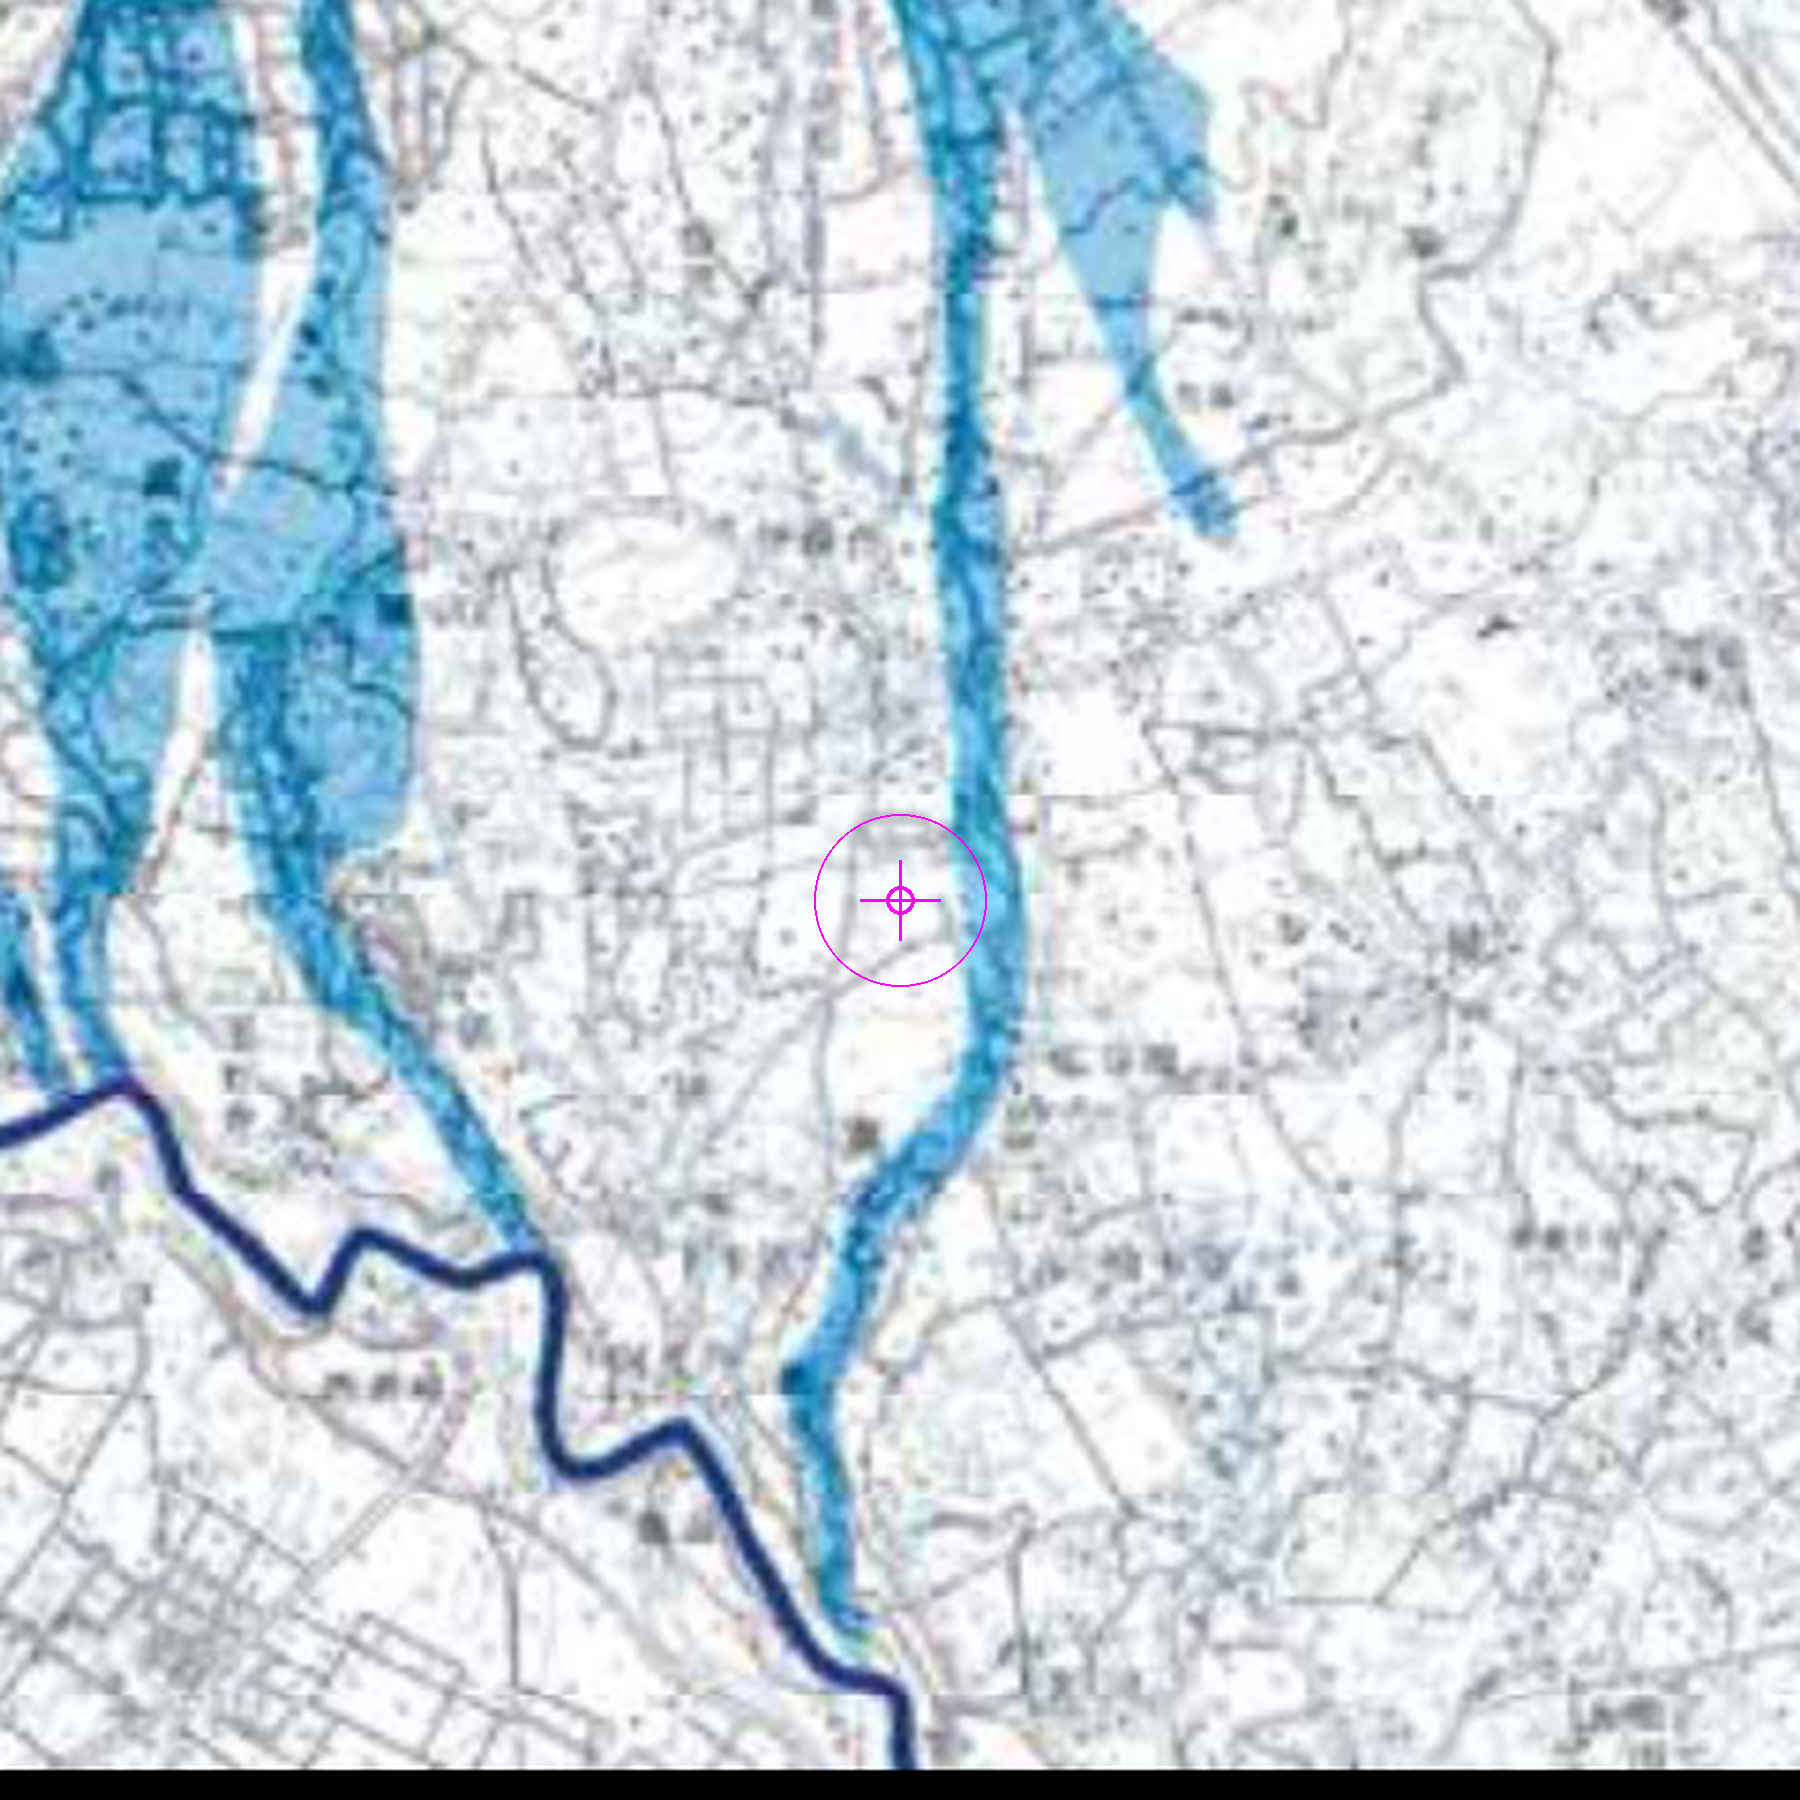
Mudflow corridors relative to the lot: a western group runs down through 那須高原 and 横沢 to the 那珂川 near 西岩崎, nearest about 0.75 km west; a central lobe covers 一ッ樅 and 御富士山 and a debris-flow ribbon follows the stream about 350 m east of the lot down to the 那珂川; the 余笹川 corridor, which carries the largest ribbon, is about 3 km east. The lot lies on the interfluve between the west and east streams. JMA lists 那須岳 at 噴火警戒レベル1 (活火山であることに留意), with the level system in force since 2009-03-31 and no bulletin in the past week (https://www.data.jma.go.jp/vois/data/tokyo/STOCK/activity_info/301.html, accessed 2026-09-20). Details: step5_6_volcano_terrain.md.
Micro-terrain
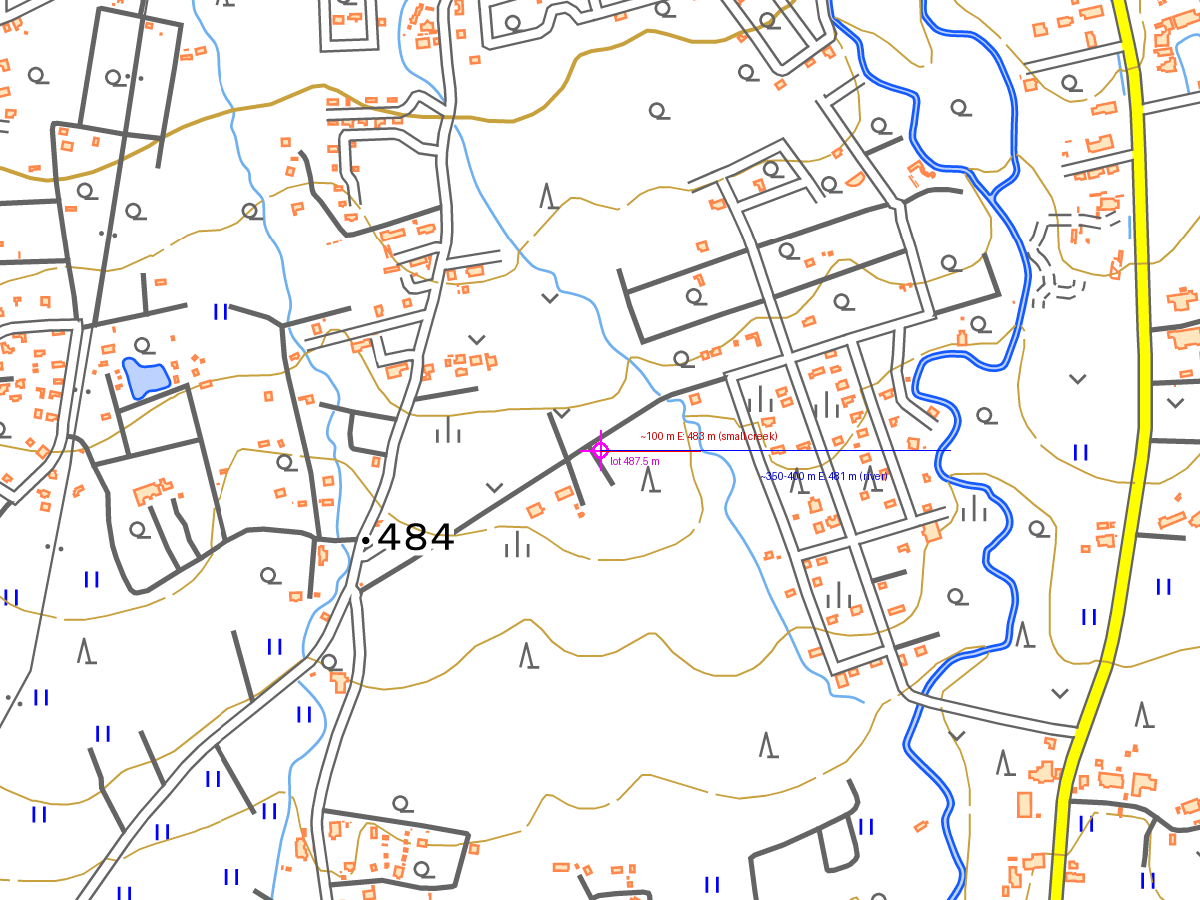
105 GSI DEM samples (1 m LiDAR) on rings at 50, 100 and 200 m and a 25 m grid within 100 m (sources/elevation_samples.json, sources/elevation_transects.json).
| Point | Elevation (m) |
|---|---|
| Lot centroid | 487.5 |
| 50 m N / E / S / W | 489.0 / 487.3 / 485.8 / 487.6 |
| 100 m N / E / S / W | 490.5 / 483.4 / 483.5 / 487.9 |
| 200 m N / E / S / W | 494.6 / 486.4 / 480.5 / 487.3 |
| Creek channel 100 m E | 483.4 |
| Larger stream 350 to 400 m E | 481.4 |
The lot is not a local low: ground rises 3 to 7 m within 200 m to the north and north-west and falls 5 to 7 m to the south and south-east. The slope across the lot is 2 to 4 percent. A thin blue line on the GSI map, a small creek or ditch, runs north-west to south-east about 95 to 100 m east of the lot, about 4 m below it, and no flood map models it. The larger stream 350 to 400 m east, 6 m below the lot, is the one carrying the 湯川-side flood band, the 土石流危険渓流 designation and the volcanic debris-flow ribbon. No pond lies within 300 m.
What the maps cannot tell you
- Landform: GSI has not published a landform classification here, so whether the ground is old lava plateau, fan or terrace deposit is not documented by any map used here. The DEM and the 1408 to 1410 eruption history suggest a volcanic slope, but that is inference, not a mapped class.
- The creek 100 m east: no flood model covers it. In a cloudburst like 27 August 1998 (90 mm in an hour), the parcels between the lot and the creek (800-75 to 800-78, 800-24) flood first. Whether it is a natural stream or a farm ditch, and whether it has ever overtopped, only neighbours or the town know.
- Pluvial flooding and road runoff on the diagonal lane: no 内水 assessment exists for this area at all.
- Landslide designation is described by the prefecture as unfinished. The absence of a zone near the lot is consistent with its gentle slope, but it is not a completed survey.
- Volcanic lahar: the town's map has the lot in a gap between two lobes, and the positional error of a scanned 1:200,000 map is about the same as the gap. The eastern lobe follows the stream 350 m east; the lot is 6 m above that channel.
- Ashfall of 20 cm or more is the town's own figure; the map cannot say how likely a magmatic eruption is in any given decade beyond "数千年に1回".
- The shaking map is a 250 m mesh at 1:200,000, so 震度6弱 versus 6強 at this exact lot is a coin toss between neighbouring cells. Site-specific ground condition (地盤) is not on any public map here.
- The lot placement itself carries 10 to 20 m of uncertainty; all distances above are relative to that point.
Questions for 那須町 総務課 危機管理係 (0287-72-6901) or the seller's agent
Paste-ready Japanese:
- 那須町大字高久乙800-74について、2026年版防災マップの6図で洪水浸水想定区域・土砂災害警戒区域のいずれにも含まれていないと読み取りましたが、町として同地番に係る指定・予定区域はありますか。
- 同地番の東側約100mに小さな水路(沢)が地図上にありますが、これは河川か農業用水路か、また過去に溢水した記録はありますか。管理者はどこですか。
- 平成10年那須水害の際、高久乙800番地周辺(下半俵〜高久乙、道の駅那須高原友愛の森の西側)で浸水や土砂流出はありましたか。
- 那須岳火山防災マップの融雪型火山泥流到達範囲について、高久乙800番地付近は範囲内か範囲外か、町の原図(GISデータ)で確認していただけますか。
- 那須岳の降灰後の土石流危険区域予測図で、道の駅那須高原友愛の森の西を流れる沢沿いの青い帯は、高久乙800-74の敷地にかかりますか。
- 栃木県の土砂災害警戒区域の基礎調査は高久乙地区で完了していますか。未完了の場合、調査予定はありますか。
- 揺れやすさマップ(那須町直下M6.9)で同地番は震度6弱の区画と読みましたが、町が把握している地盤情報(ボーリング柱状図等)は近隣にありますか。
- 同地番を含む地域の指定緊急避難場所・指定避難所と、車で避難する場合の推奨経路(県道17号の湯川浸水区域を避ける経路)を教えてください。
- ため池ハザードマップ(P57-P58)以外に、高久乙地区に町が把握している小規模ため池や調整池はありますか。
- 内水氾濫(雨水排水)について、高久乙800番地周辺の道路冠水の記録はありますか。
For the seller's agent, in addition: 過去の浸水・土砂・倒木被害の有無、敷地内の排水経路と側溝の接続先、隣接する水路との境界確定の状況、および重要事項説明書に記載されるハザード情報の根拠図版(版・年)を教えてください。
Method notes and failures
- MAPPLE法務局地図ビューア requires a login for 地番 search; not used. G空間情報センター requires a login for the raw 登記所備付地図 download; not used. The same data was obtained from 公図ビューア without login.
- The Chrome extension disconnected after the prefecture step; the remaining JMA check was done with plain HTTP.
- The prefecture app's terms-of-use dialog was not accepted; its data was read through the public REST services instead.
- GSI seamless aerial tiles stop at z18, so the close-up pin image is a z18 crop.
- Every distance to a zone is measured from the lot centroid to the nearest mapped pixel or polygon, on a map that itself has 1 to 8 m per pixel; treat distances under 50 m as "adjacent".
Files
location.json,location.png,location_context_z18.pngtown_sheet_crop.png,step2_town_map.mdpref_dosha_overlay.png,sources/pref_layer_query.json,sources/tochimarumap_layers.jsonvolcano_crop.png,volcano_debrisflow_crop.png,terrain_crop.png,step5_6_volcano_terrain.mdsources/holds every PDF, tile, screenshot and JSON cited above.site/is the deployed interactive map;build_site.pyrebuilds it.
Full markdown: report.md